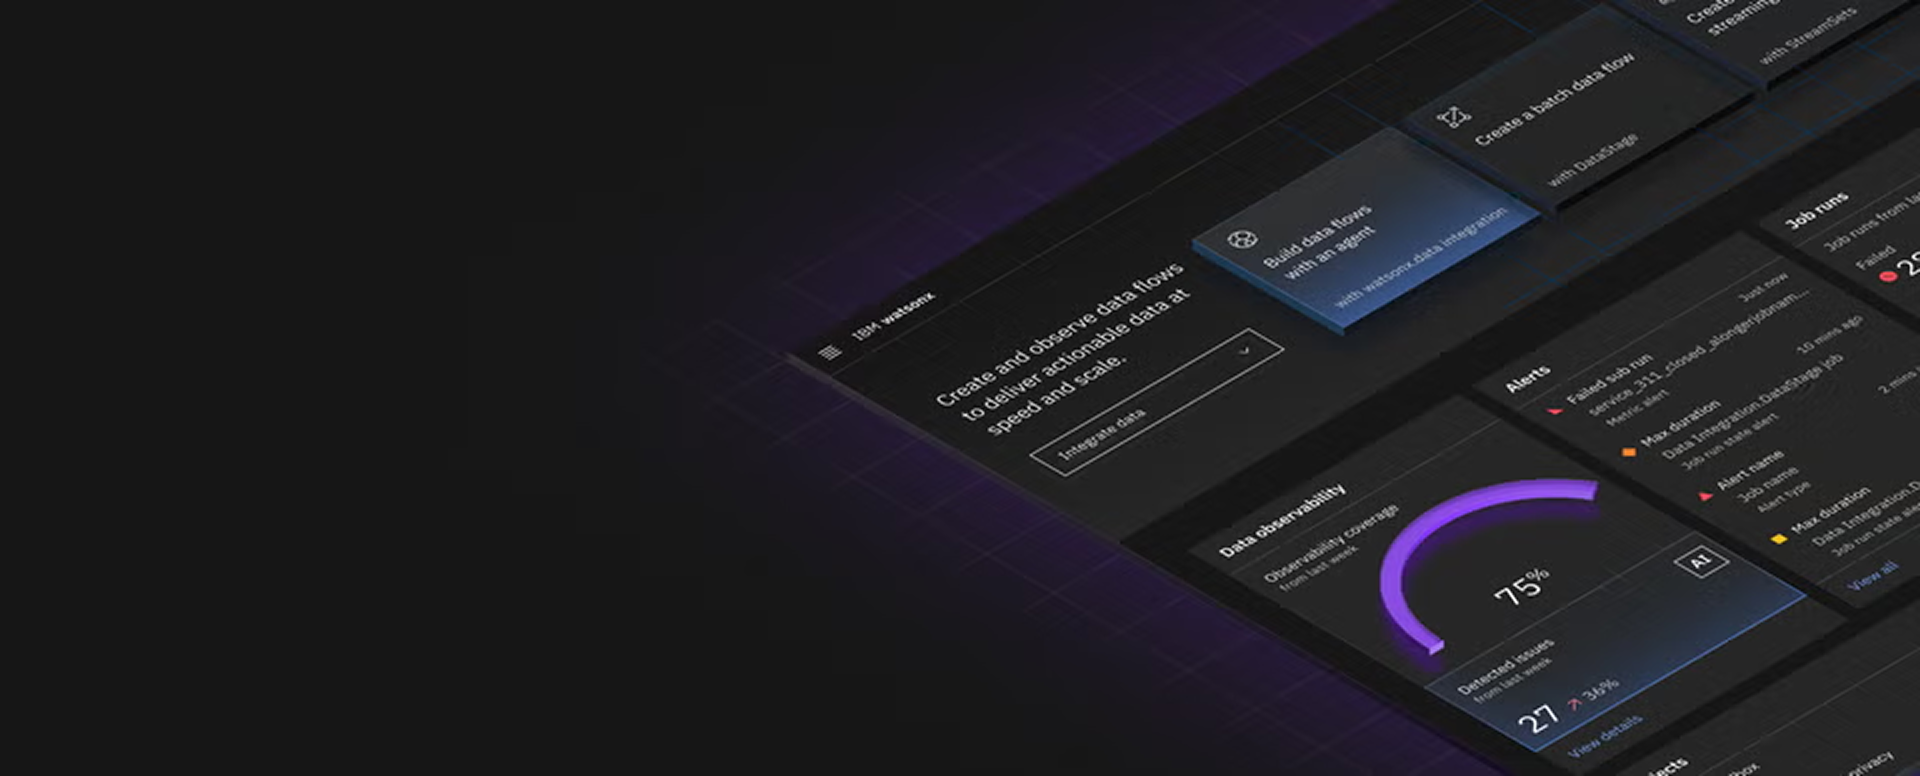
CASE STUDY · IBM · 2024-2025
Making observability IBM native
Embedding Databand into Watsonx.data integration, under an 8-month runway.
- MY ROLE
- Lead Designer of 3 designers, Data Observability
- TEAM
- Lead PM + engineering & design across 3 product orgs
- TIMELINE
- 8 months to MVP
- PLATFORM
- IBM Watsonx.data integration
- TOOLS OBSERVED
- DataStage · StreamSets · Airflow · Spark
- METHODS
- Personas · user flows · IA · MVP scoping · exec alignment
KEY OUTCOMES
What the project delivered
4
Main sections, with core user flows designed and delivered for the integrated experience
4
Core alert types delivered in the MVP, with future scalability
3
Research inputs behind the MVP, user interviews, Amplitude usage, and standalone UX debt
Native observability placement
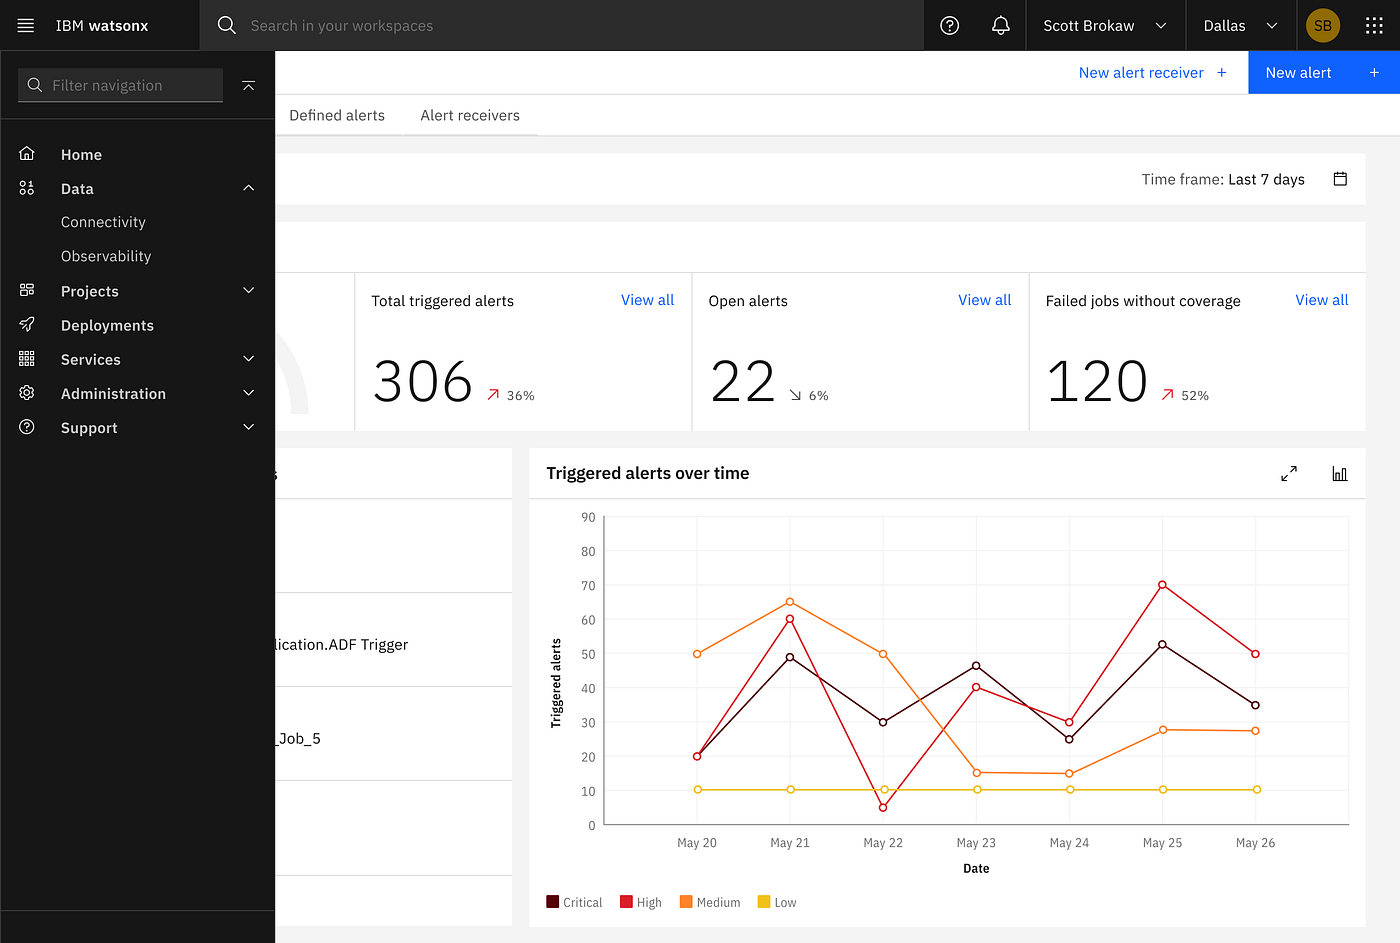
Defined a dedicated, top-level Data Observability section in the Watsonx IA, giving it clear presence instead of burying it inside Projects, Spaces, and Catalogs.
Alerting inside the workflow
Moved alert configuration into the job-creation flow, so observability became a native step in build → monitor → fix rather than a separate tool users skipped.
One experience across tools
Unified monitoring for DataStage and StreamSets in one place, removing the need to jump between separate tools to watch pipelines.
A scalable foundation
Shipped the MVP as a base future integrations can extend, Catalog assets and other Watsonx AI tools, as the platform grows.
MY ROLE
Leading the integration end to end
As the lead designer on the Databand team at IBM, I led the design of the integration and, together with the Lead PM, defined the strategy for how to execute it, aligning goals, priorities, and a shared vision across product, engineering, and design in three product orgs. I owned the end-to-end user experience and made sure it fit seamlessly into the broader Watsonx workflow.
I defined the UX debt carried over from the standalone Databand product and set the UX prioritization for the MVP, deciding what to fix, move, and defer under an 8-month runway. I presented and defended the proof of concept to the VP of Design for Data & AI to secure executive buy-in, and led cross-team design workshops to align on a single, unified flow. All within IBM’s Carbon design standards.
CONTEXT
What is Databand?
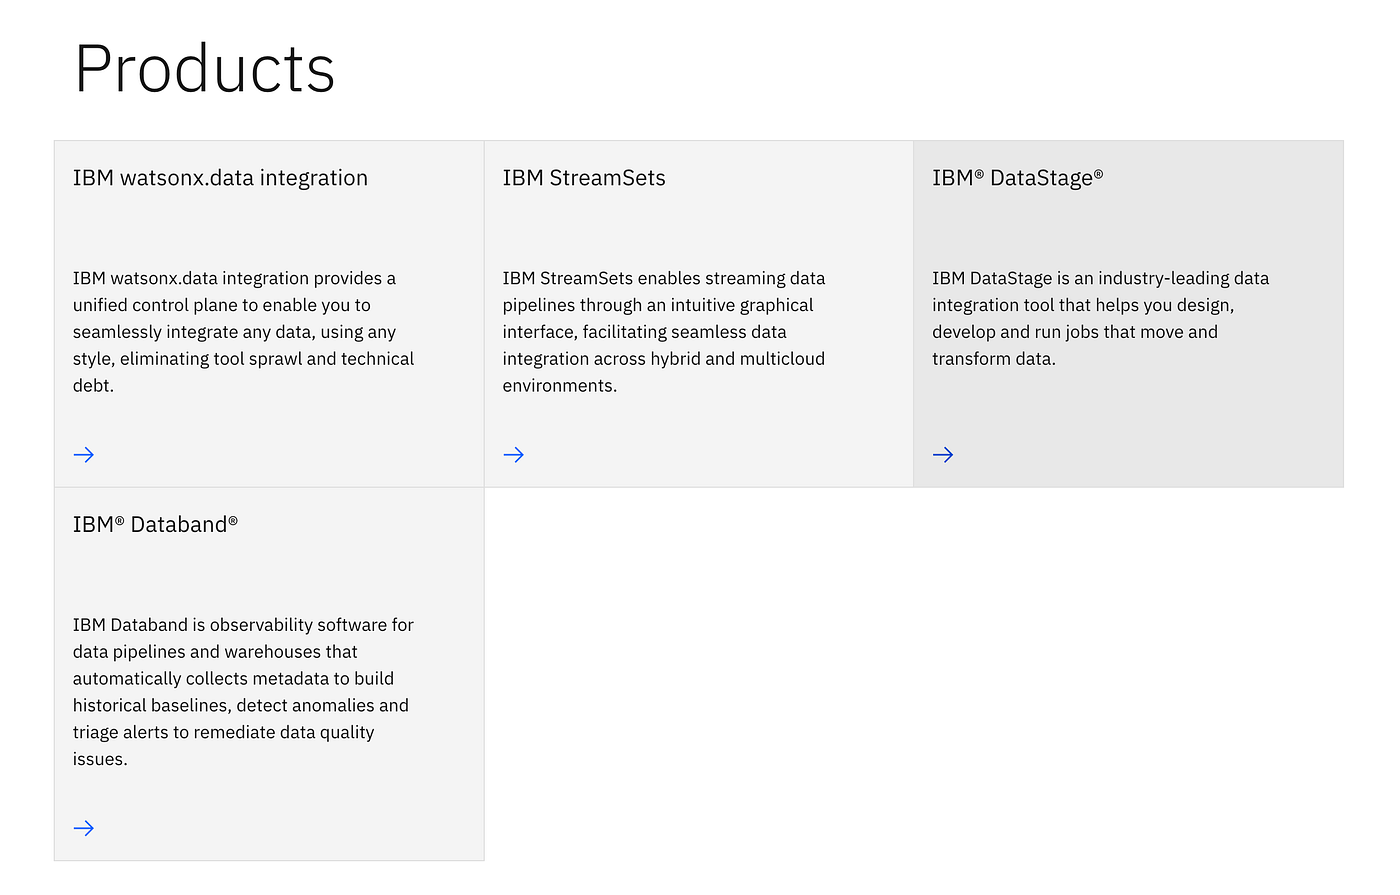
Databand is a data observability tool that helps data teams detect, investigate, and prevent issues in data pipelines: monitoring job runs, tracking data-quality metrics, and alerting users when something goes wrong (failed jobs, delays, anomalies). Built as a standalone product, it integrated with tools like Airflow and Spark; after IBM acquired it, DataStage and StreamSets were added to give engineers end-to-end visibility into pipeline health.

PREPARATORY STEP
Auditing what to keep, migrate, and rethink
With a tight timeline, I started with a review and audit as a preparatory step, mapping what could move one-to-one into the Carbon design system, what was UX debt that needed rethinking, and how all of it had to work within the information architecture of Watsonx.data integration. Doing this upfront is what let me land on the most efficient solution within the schedule.
Transfer one-to-one
Fonts, icons, tokens, and primitives like buttons and inputs mapped cleanly to Carbon and could move across as-is, with no redesign.
Flag the UX debt
Patterns that weren’t performing, based on usage data and internal feedback, were marked as UX debt to rethink rather than port over.
Fit the platform IA
Every call was checked against the information architecture of Watsonx.data integration, so components worked within the larger platform, not just in isolation.
Efficient under pressure
Auditing upfront quantified the work and avoided redesigning components that would map anyway, the key to delivering within a tight schedule.
- Keep one-to-one → design system
- UX debt → rethink
- Aligned to Watsonx IA
THE PROBLEM
Observability lived outside the work-flow
Databand gave teams powerful observability, but it ran as a separate tool, outside where users built and managed their data flows. DataStage had no issue-detection tooling, and StreamSets had only a very limited one.
CONSTRAINTS
What I designed around
Tight timeline
An 8-month runway to ship a working MVP and deliver the DataStage version.
Limited data access
DataStage and StreamSets were still being integrated into Watsonx, so user data to validate edge cases was scarce.
Complex IA
A layered structure, Projects, Spaces, Catalogs, where every entity was an asset Databand would observe.
THE GOAL
Prove observability belongs, without friction
Embed Databand’s observability into Watsonx.data integration, with three priorities:
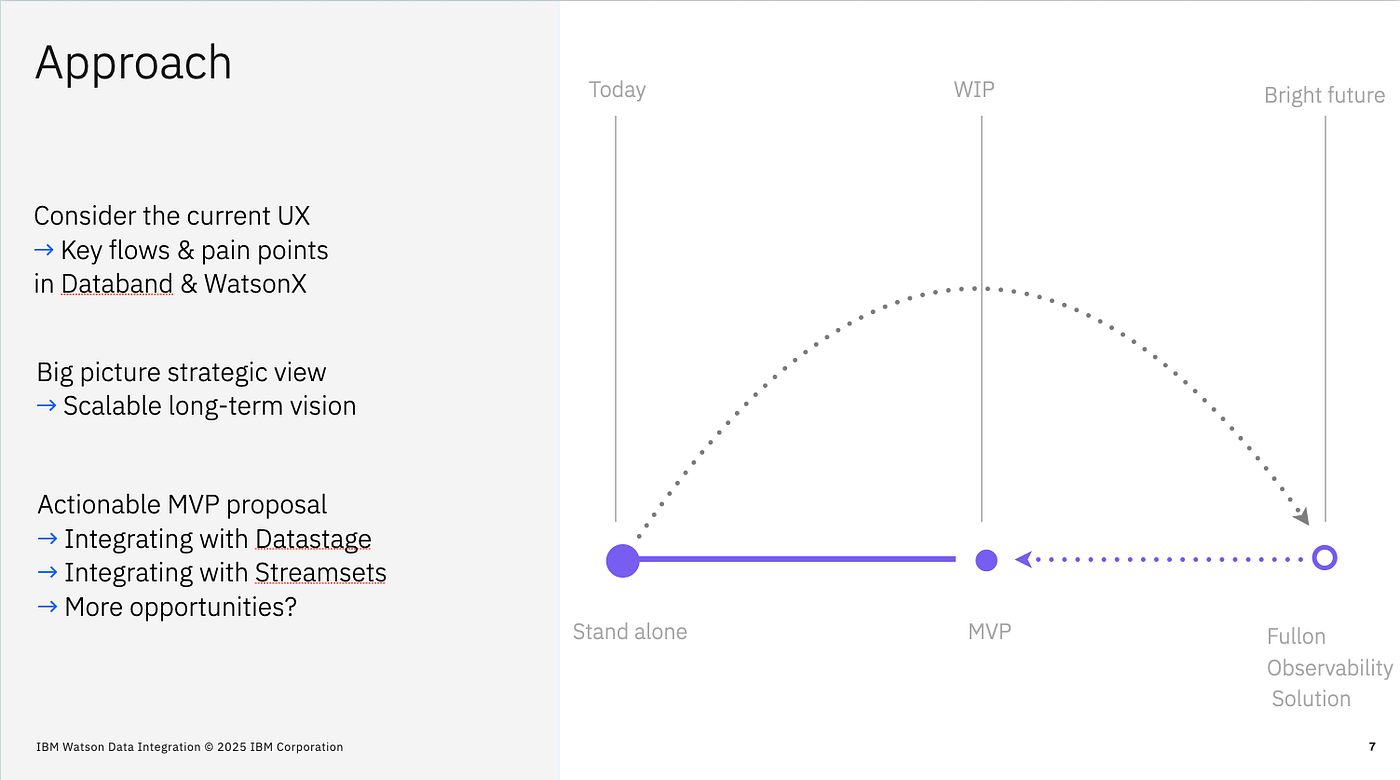
KEY TRADE-OFF, WHAT I LEFT OUT
RESEARCH & INSIGHTS
Designing for real engineering roles
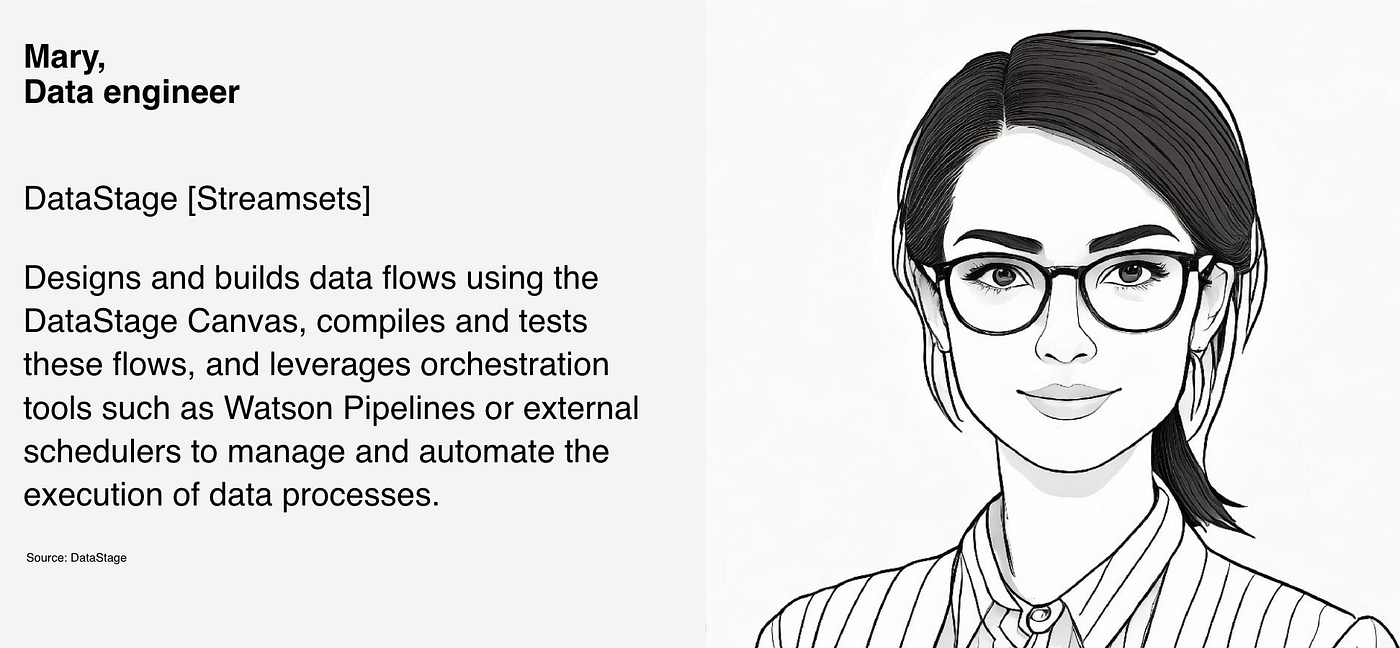
Drawing on qualitative and quantitative data from the standalone Databand: user conversations, Amplitude usage, and accumulated UX debt, I scoped the MVP. Rather than build personas by job title, I organized them by their role in the pipeline lifecycle. That choice drove where alerts should live and what metadata mattered during triage.
Data Engineer / Pipeline Developer
Creates and schedules jobs, needs alerts close to where they work.
On-call Engineer / Ops Lead
Watches for issues, needs clear context and fast triage.
Data Engineering Team Lead
Tracks job health and team performance across pipelines.
DEFINING THE UX DEBT
Turning scattered debt into a prioritized backlog
Before designing, I aggregated the UX debt carried over from the standalone Databand product into a single board, pulled from user research, design reviews, and internal feedback. I grouped it by product area (Pipelines, Run details, Dashboard…), scored each item by priority and effort, and used it to decide what to fix, move, or defer in the MVP.
- Grouped by product area
- Scored by priority × effort
- Fed directly into MVP scope
RESOLVED IN THE MVP
Live View → Issue Detection
Reviewed how Live View was performing, reframed it as Issue Detection, and surfaced it on the dashboard, instead of a separate page.
Alert flow simplification
Streamlined the alert-creation flow, fewer steps to define a threshold, choose targets, and route notifications.
Metrics section
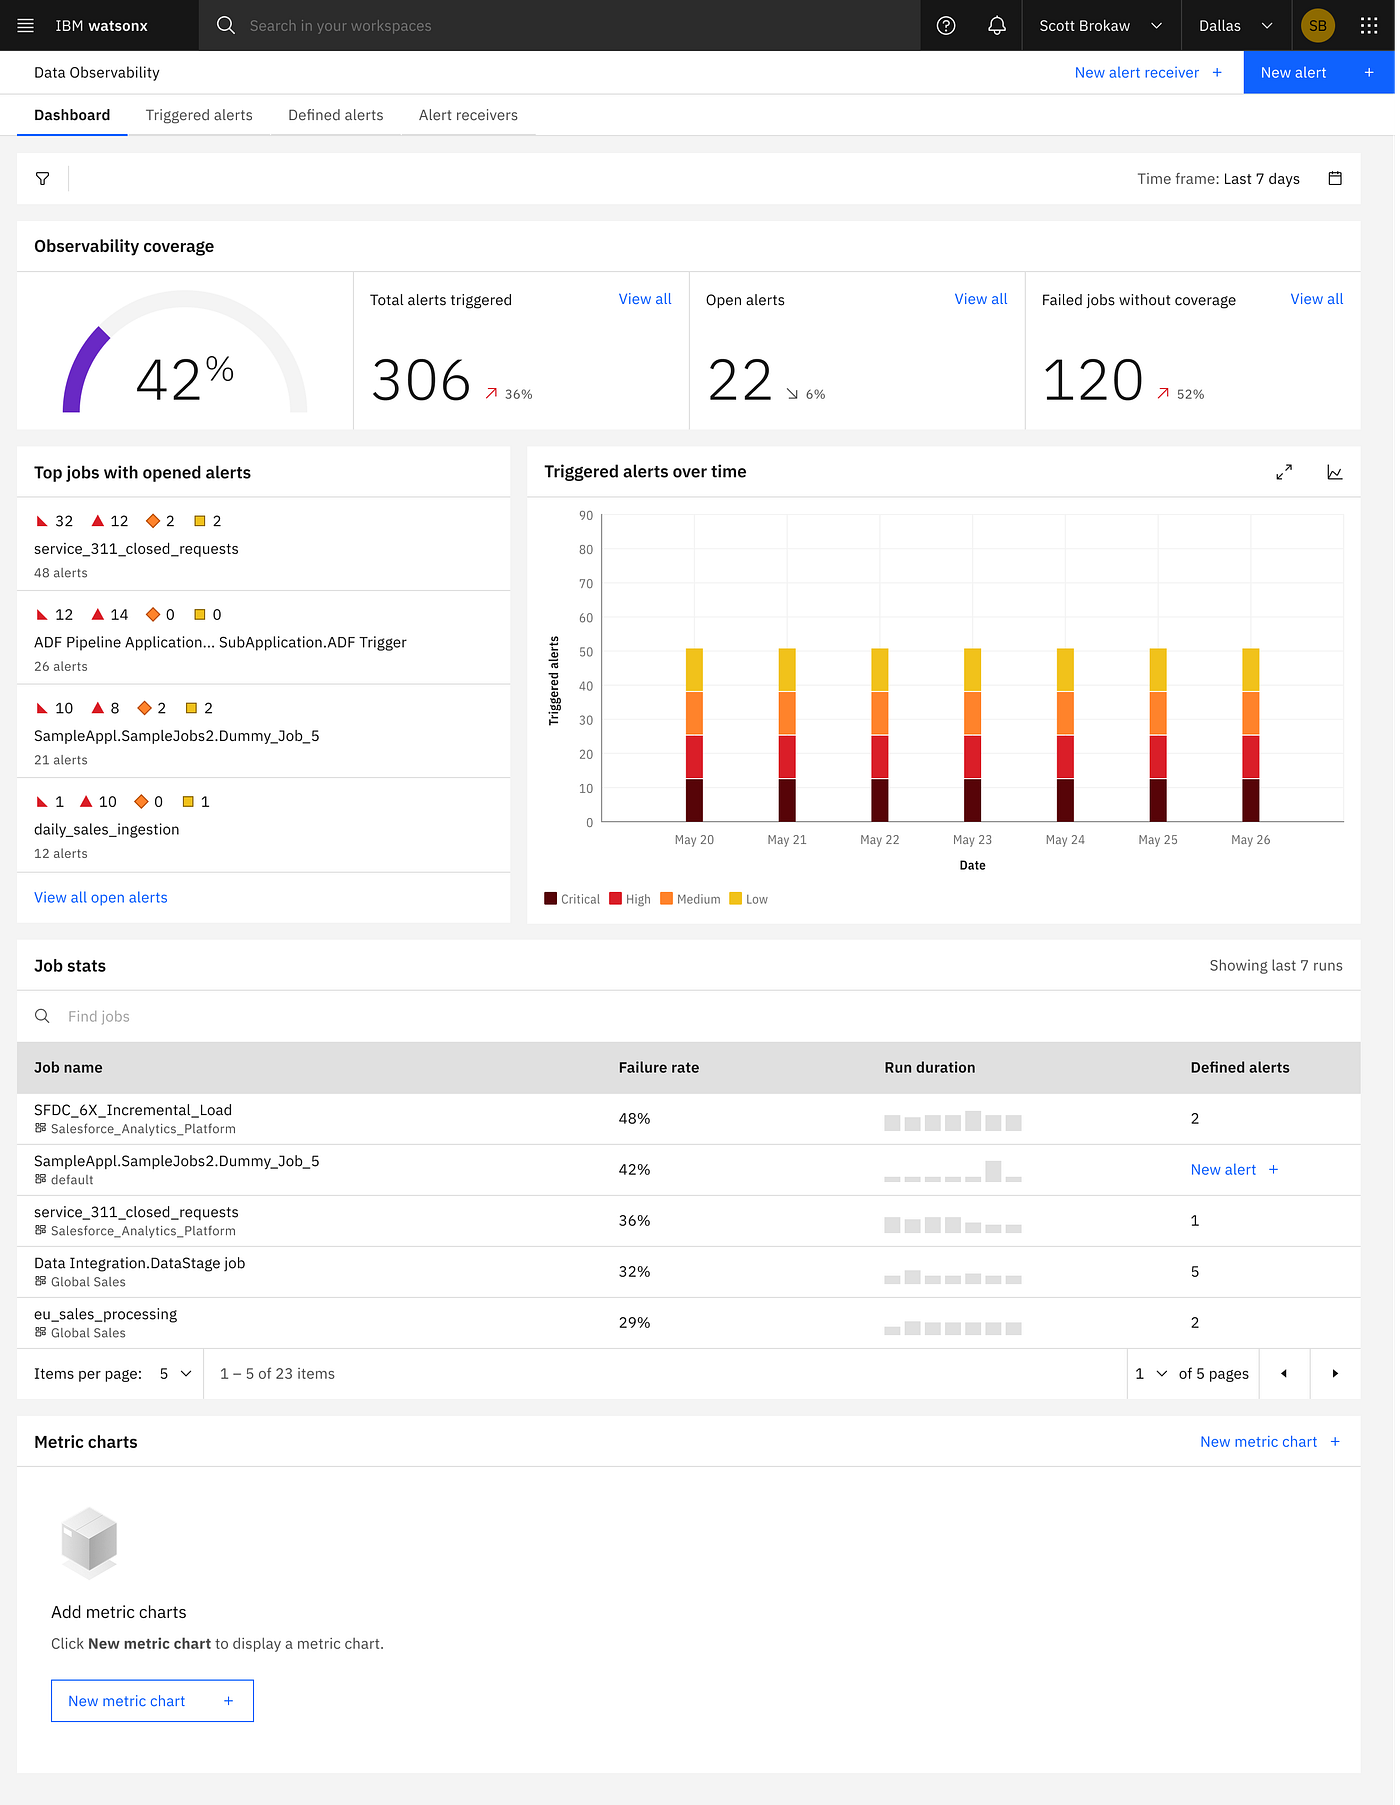
Surfaced coverage and key metrics on the new Observability Dashboard, with a clear hierarchy.
Filtering behaviour
Fixed inconsistent filtering so it behaves the same way across every page, not differently on each.
Dashboard structure
Reorganized into a scannable dashboard that prioritizes alerts and pipeline health.
USER FLOW
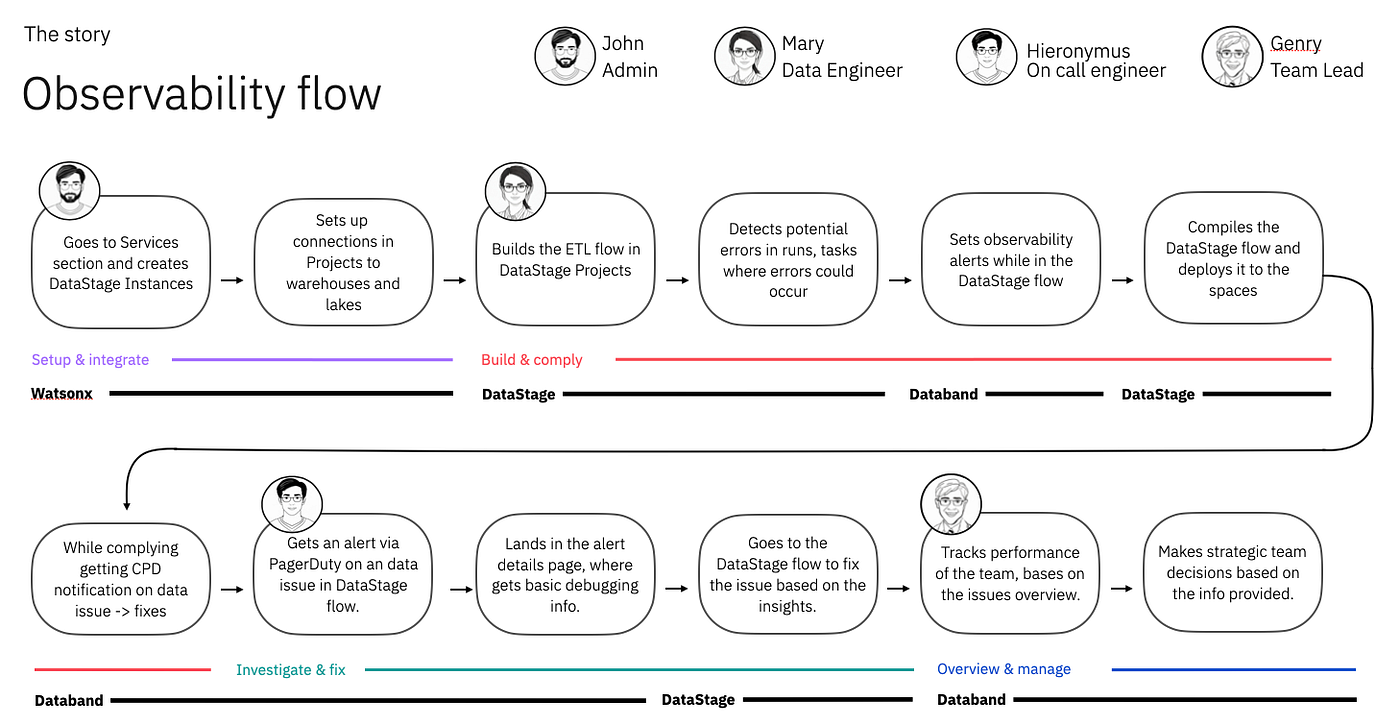
One path: build → alert → resolve
I mapped the existing journeys across Databand, DataStage, and StreamSets, found the gaps between building, monitoring, and debugging, and designed a cohesive flow aligned to the MVP, so users move from job creation to alert configuration to incident resolution, all within Watsonx.data integration.
THE CORE DECISION
Where should observability live?
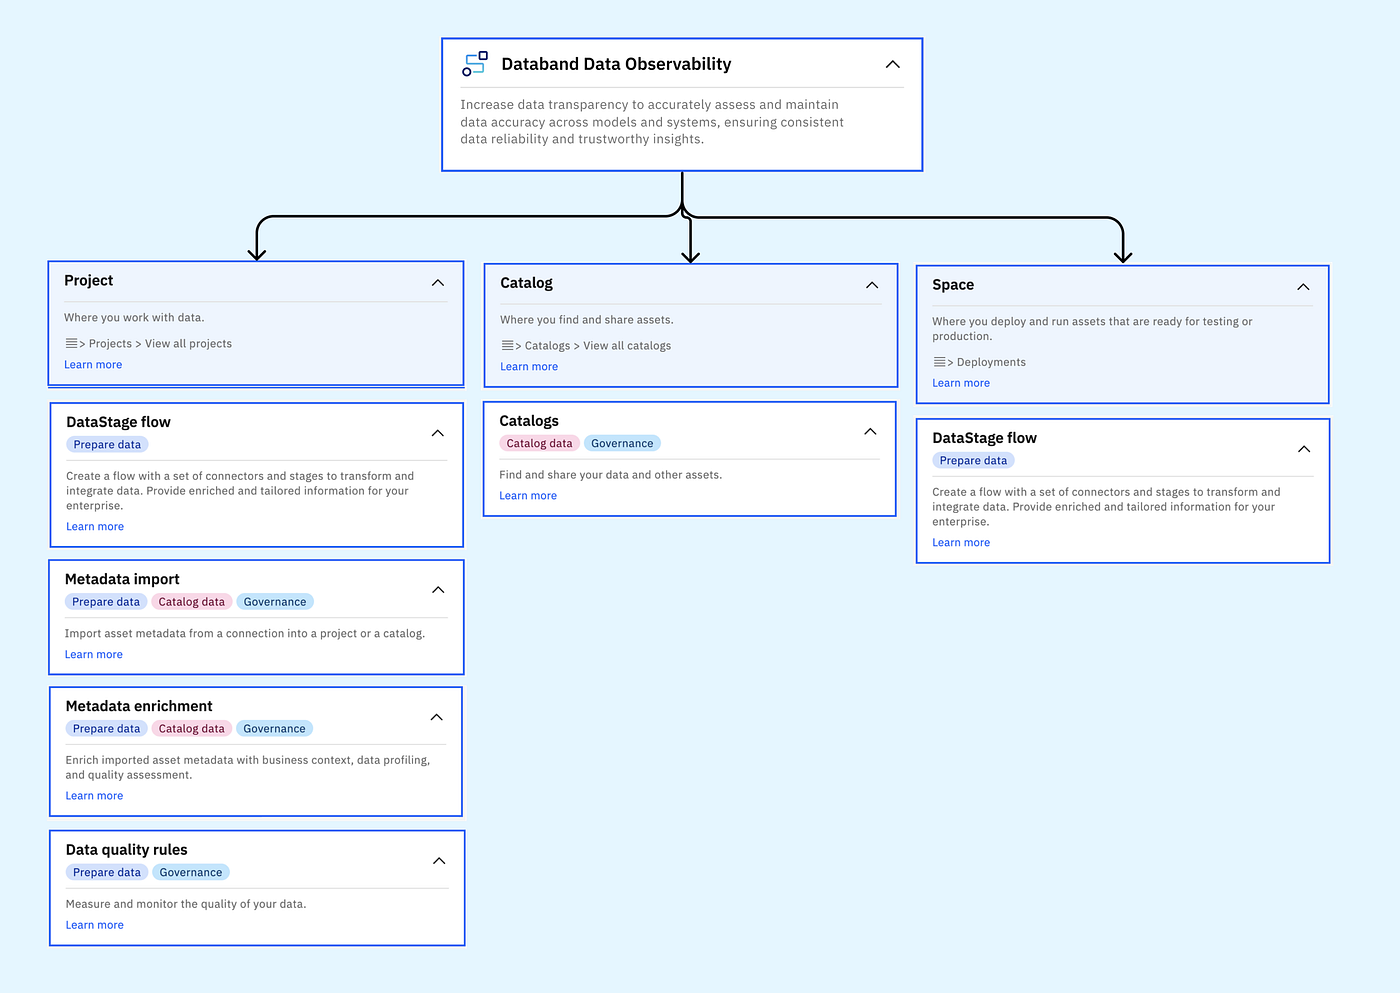
The most strategic, and most challenging, part of the integration was deciding where observability should sit inside a platform that wasn’t built for it.
✕ REJECTED
Embed inside Projects, Spaces & Catalogs
It felt natural, but it would scatter observability across containers, bury its visibility, and confuse users about its role.
✓ CHOSEN
A dedicated, top-level Data Observability section
Observability operates at a meta level, monitoring jobs, tasks, and datasets across Projects, Spaces, and Catalogs. A first-class section in the Data tab gave it clear presence, unified the experience across DataStage and StreamSets, and set a scalable foundation for future integrations.
WHAT I SHIPPED
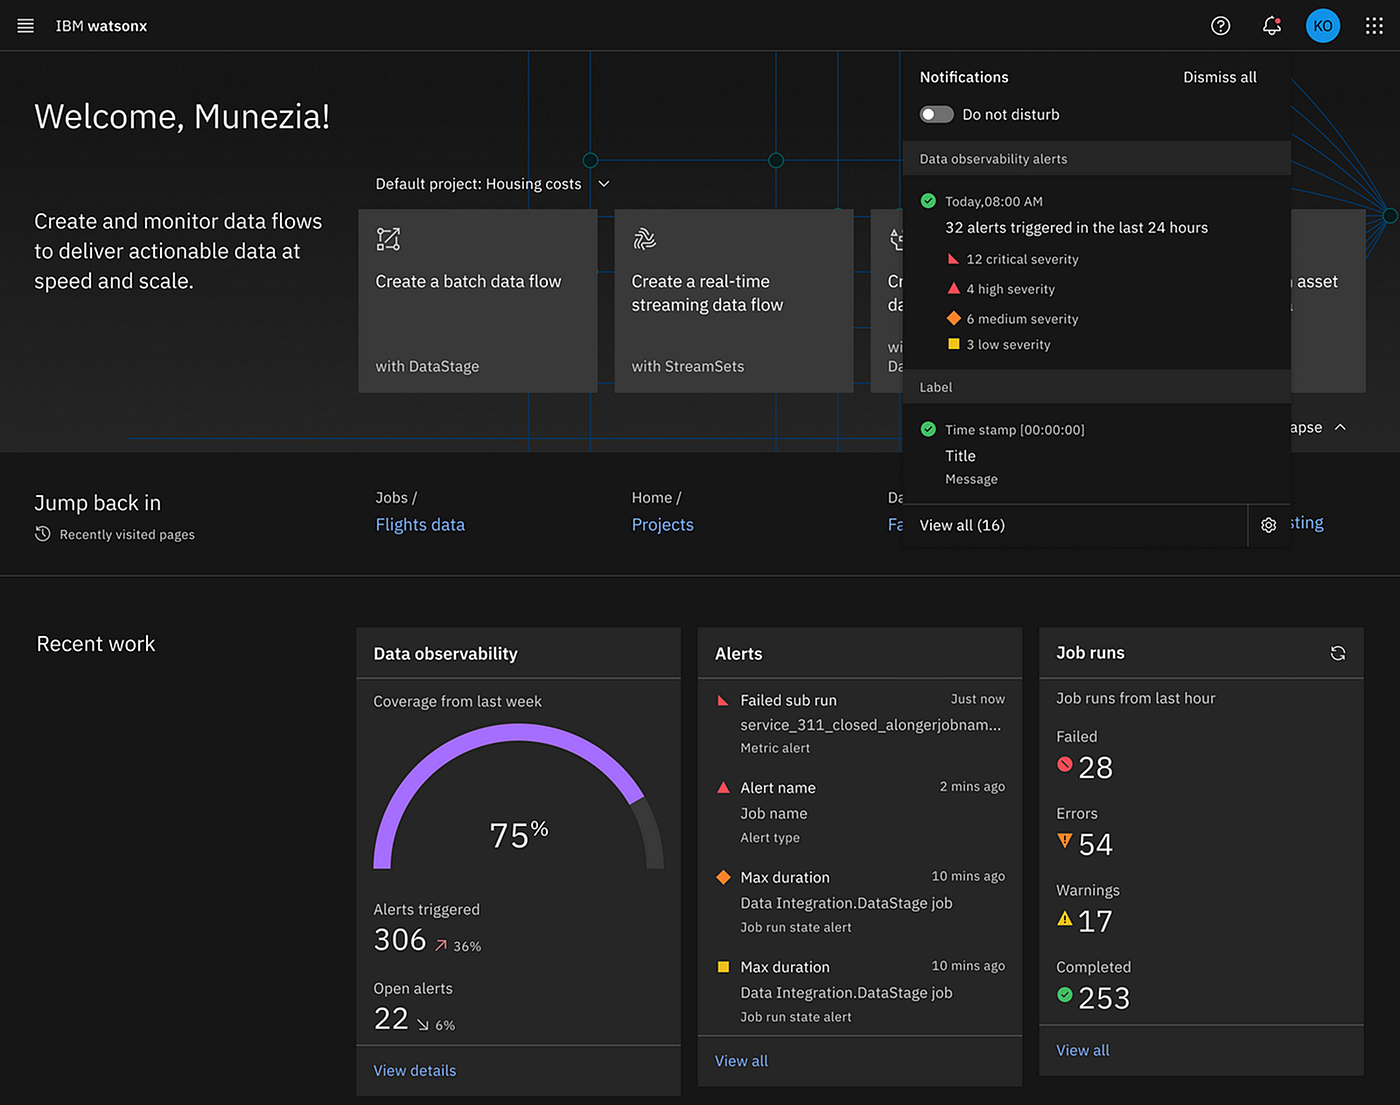
A scalable observability MVP
Observability Dashboard
Track coverage, alerts, and pipeline health (for both engineers and team leads) in one place.
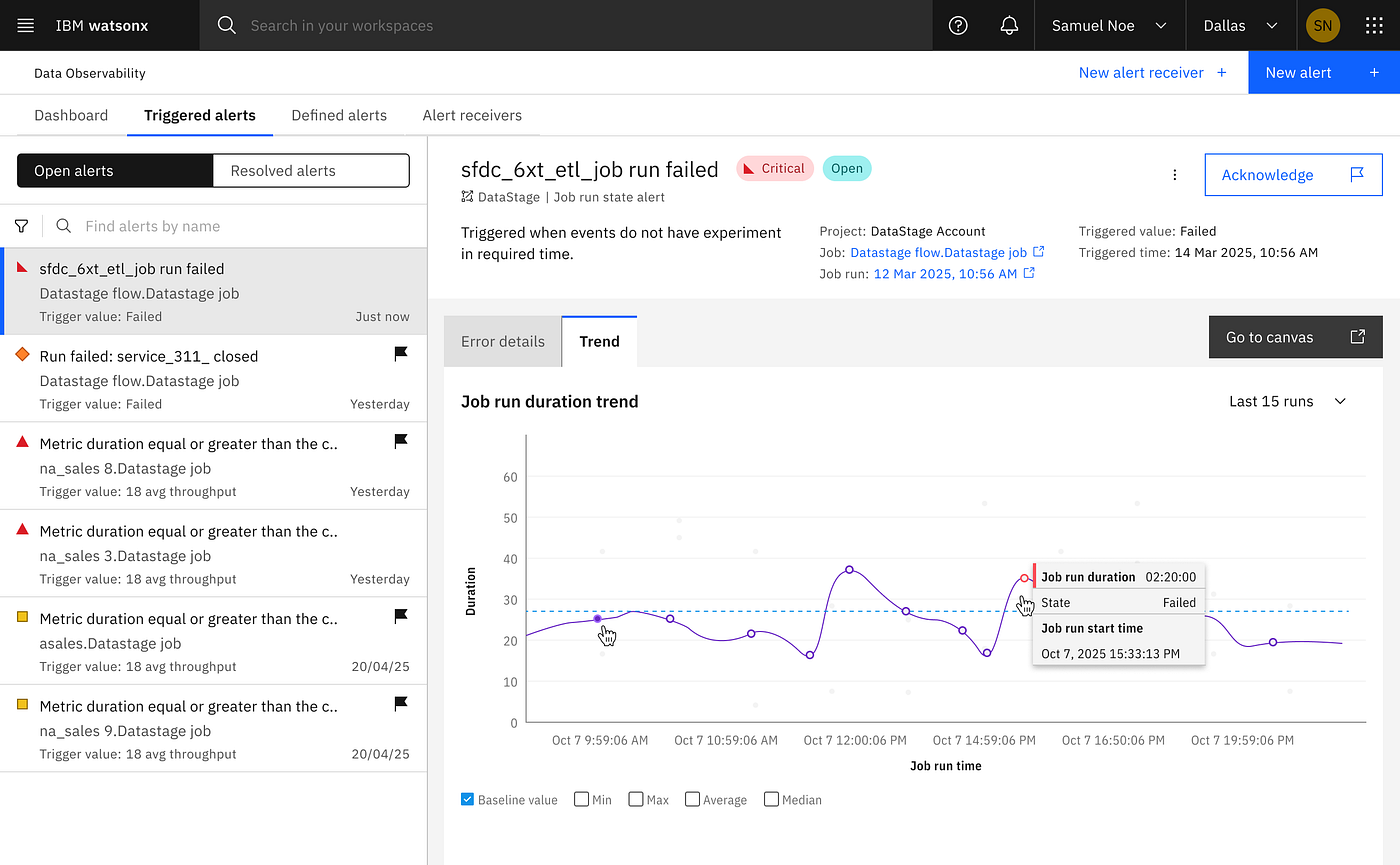
Defined & Triggered Alerts
Create, manage, and investigate issues directly within the platform.
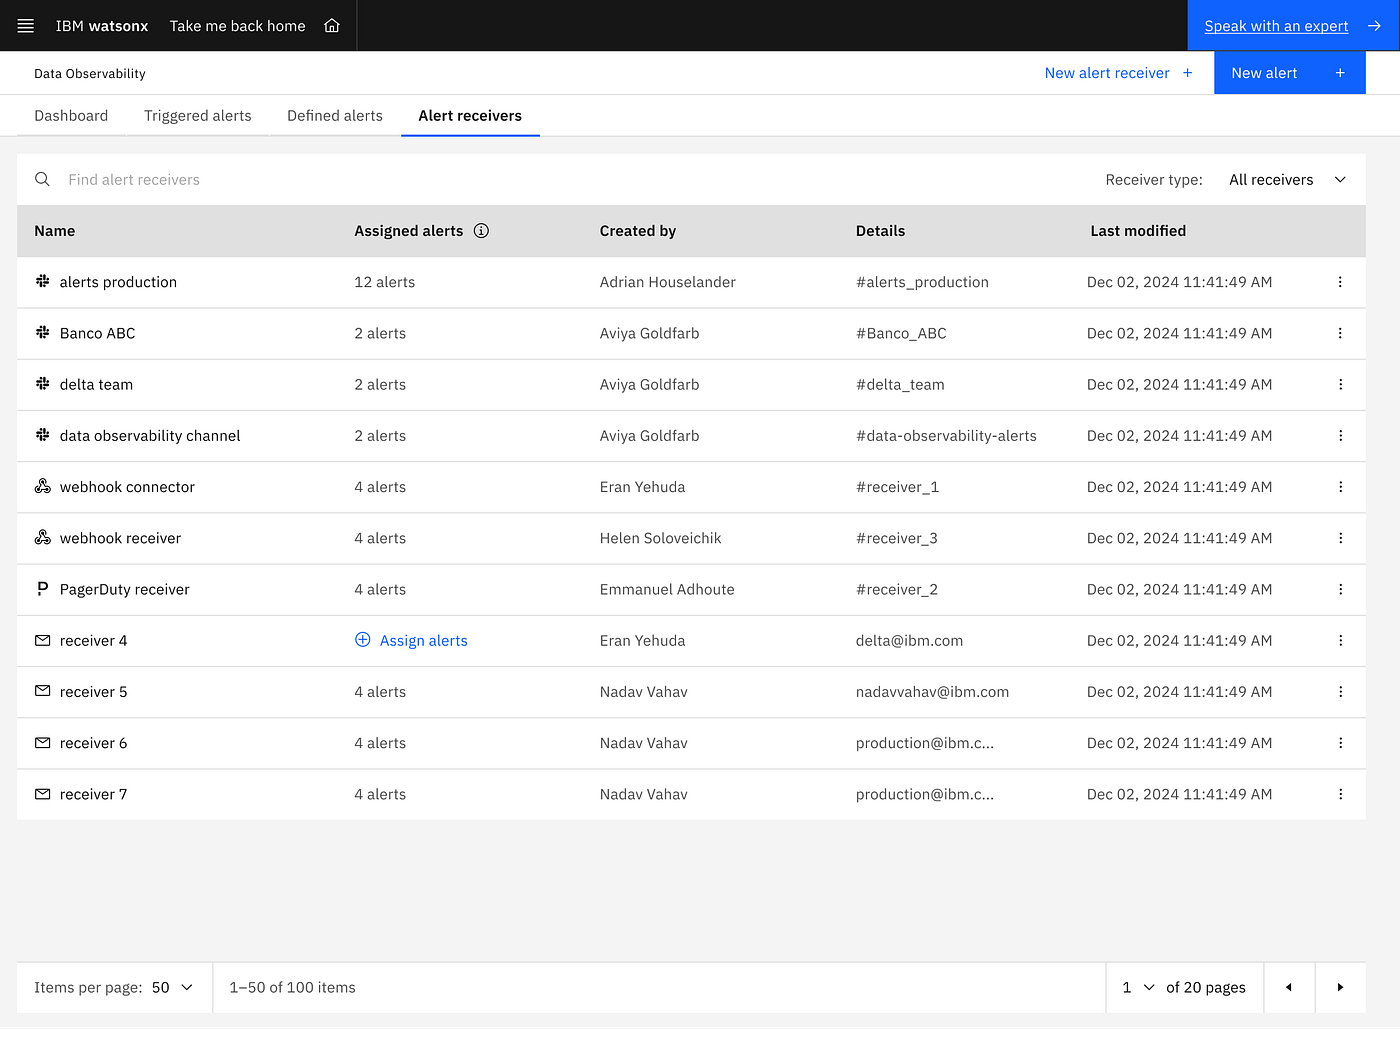
Receivers
Control who gets notified, and through which tools, like Slack.
Cross-platform Notification Center
Issues surface while users work anywhere in Watsonx.
IMPACT
What changed
Previously, alerting lived in a separate tool, outside job creation, so most users skipped it and issues surfaced late. In the integrated experience, alert configuration is part of the build flow inside Watsonx: observability moved from an optional, disconnected step to a native part of the pipeline lifecycle.
1
unified workspace to build, monitor & fix, down from 3 separate tools (DataStage / StreamSets + Databand)
62%
of DataStage jobs have alerting configured, up from 18% when it required the standalone tool
~40%
faster time-to-detection of pipeline issues for teams on the integrated experience
Think 2025
shipped as a native Watsonx capability, announced by the VP of Data Integration

LEARNINGS
What I took away
Placement is a product decision, not a layout one
The biggest lever wasn’t a screen, it was treating observability as a top-level, cross-product capability. That IA call is the pattern I’d reuse for anything that operates across a platform rather than inside one part of it.
Designing under data scarcity
With DataStage and StreamSets still being integrated, I couldn’t validate every edge case. I leaned on standalone usage data and cross-team SMEs as proxies, and scoped the MVP so the riskiest assumptions could be tested after launch.
Alignment is the real work at this scale
Shipping across three product orgs in 8 months made stakeholder alignment as important as the design, defending the POC to the VP of Design and running cross-team workshops were what unblocked the direction.
Managing the team is its own design problem
Mentoring a senior, a mid-level, and a junior designer through this reminded me that leadership is contextual: the junior needed clarity and hands-on guidance, the senior thrived on autonomy. I set clear goals, defined ownership early, and connected each person’s work to the bigger picture, treating team management as a craft as deliberate as the product design itself.
What I’d validate next
Whether the deferred MVP features are truly needed, how the top-level Observability section holds up as more Watsonx tools plug in, and where triage still causes friction post-launch.